
Educators:
Markus Stepath, Karin Schork, Nils Hoffmann (BioInfra.Prot / LIFS)
Date:
Monday, 7th Dec 2020
Location:
Online training
Contents:
In this course you will learn how to use the ggplot2 package in R to create informative and beautiful figures to communicate your omics data and analysis results.
We will cover the following topics:
- Usage of the tidyverse for data preprocessing
- Usage of the ggplot2 R package
- Presentation of different types of graphics and when to use them
- Customization of graphics
Please be aware that basic knowledge of R is taught in our course “Differential analysis of quantitative proteomics data” on Monday, 2nd Nov 2020 (http://goo.gl/forms/mpKHnbT1Um).
Learning goals:
- Using the ggplot2 R package to create graphics for omics data
- Decide which type of graph is appropriate for the given data
- Ability to customize the graphics using ggplot2
Prerequisites:
- Basic understanding of high-dimensional data sets from quantitative proteomics or other life sciences;
- Basic knowledge of R (e.g. data import, basic plots. This can for example be gained from our course “Differential analysis of quantitative proteomics data” (Monday, 2nd Nov 2020, http://goo.gl/forms/mpKHnbT1Um).
- Computer with stable internet connection, headset and camera
Keywords:
R; tidyverse; ggplot2; high-throughput data; omics; proteomics; data analysis, graphics, data preprocessing
Tools:
Download and more information on R here:
https://cran.r-project.org/
We recommend using an editor such as RStudio, see
www.rstudio.com
Contact:
Number of participants Number of participants is limited to 25.
Related courses There will be a basic R course on 2nd Nov. 2020 (registration form for the basic course: http://goo.gl/forms/mpKHnbT1Um) where this kind of knowledge can be gained. Moreover, there will be also a course on advanced analysis of proteomics data using R on 9th Nov. 2020 (registration form for the advanced course: https://forms.gle/3pkpVmWKdbShJwWz5). You can visit all three R courses or only one or two of them. In any case, you have to register for each of these courses separately.
More information
- Flyer: 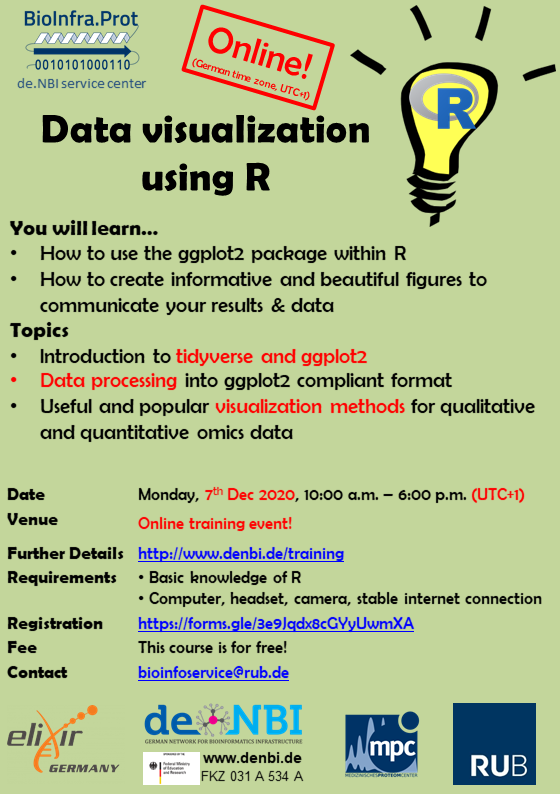
- Registration: https://forms.gle/3e9Jqdx8cGYyUwmXA
- Hosts https://www.ruhr-uni-bochum.de/mpc/forschung/medical_bioinformatics/bioinfraprot.html.de